A Neuro-Fuzzy Decision Model for Prognosis of Breast Cancer Relapse
Jerez J.M.a), Peláez J.I.a), Condoretty A.b), Alba E.c)
a) Depto. de Lenguajes y Ciencias de la Computación
E-mail: [email protected] // [email protected]
b) Dpto. de Licenciatura en Informática
c) Servicio de Oncología, Hospital Clínico Universitario
Abstract. The prediction of clinical outcome of patients after breast cancer surgery plays an important role in medical tasks like diagnosis and treatment planning. These kinds of estimations are currently performed by clinicians using non-numerical techniques. Artificial neural networks are shown to be a powerful tool for analyse data sets where there are complicated non-linear interactions between the input data and the information to be predicted, and fuzzy logic appears as an useful tool to perform decision making in real life problems. In this paper, we present an hybrid neuro -fuzzy prognosis system for the prediction of patients relapse probability using clinical-pathological data (tumor size, patient age, estrogens receptors, etc.) from the Medical Oncology Service of the Hospital Clinical University of Malaga. Results show the classification accuracy improvement obtained by the proposed model in comparis on with an approach based on exclusively on artificial neural networks proposed in our previous work. Keywords: fuzzy logic, breast cancer, artificial neural networks, decision making, survival analysis. 1. Introduction
Prediction tasks are among the most interesting areas in which to implement intelligent system. Precisely, prediction is an attempt to accurately forecast the outcome of a specific situation, using as input information obtained from a concrete set of variables that potentially describe the situation.
A problem often faced in clinical medicine is how to reach a conclusion about prognosis of cancer
patients when presented with complex clinical and prognostic information, since specialists usually makes decision based on a simple dichotomization of variables into favourable and unfavourable classification [11].
In our previous work [12], the decision making process existing when patients with primary breast
cancer should receive a certain therapy to remove the primary tumor was analyzed, and a new system approach based on specific topologies of neural networks for different time intervals during the follow-up time of the patients was proposed, in order to make predictions over the patients outcome. The importance of different prognostic factors becoming significant predictors for overall survival was also analyzed. Some of these prognostic factor were discretized by the medical experts (i.e., [1,2,3] values for the grade of tumor; [1, 2] for estrogens receptors), although the loss of information taken place by this discretizing process could result very significant.
In this sense, fuzzy logic appears as a very appropriate tool for decision making problems in real life.
Many of these decision making processes are performed with a lack of knowledge about the possible options to be chosen, as well of the consequences derived from a taken decision. In this cases, a lack of precision can arise implicit in the obtained results. The fuzzy logic [6] as well as the fuzzy sets theory applied to making decision process in group, lead to obtain results according to the human being behaviour and reasoning way [4]. Besides, it incorporates a higher consistence degree to different decision making models.
This works presents a new approach based on a fuzzy -neural networks system to process in an
appropriate form these prognostic factors suspictions of being significant in the prognosis of breast cancer relapse.
This paper is organized as follows: in section 2, we present a breast cancer overview; in section 3 the
experimental material to be used is described; in section 4 we propose the fuzzy-neural networks system; in section 5 the experimental results are analyzed and compared to the previous work, and the final conclusions and future works are described in section 6. 2. Breast Cancer Overview
The most common types of breast cancer are called ductal carcinoma and lobular carcinoma, and for both types the cause is unknown. Recently two genes, BRC1 and BRC2 have been implicated in a certain type of breast cancer, and a number of other predisposing and prognosis factors have been identified including, for example, obesity, early menarche, pregnancies, number of estrogens receptors and size of tumor. Breast cancer can occur in men as well in women, but is mu ch more common in women. The risk increases exponentially after age 30. In general, the rate of breast cancer islower in underdeveloped countries and higher in more afflue countries.
As we enter the new millennium, treatment modalities exist for many solid tumour types and their use
is well established. Nevertheless, an offset against this is the toxicity of some treatments. There is a real risk of mortality associated with treatment, so that it is vital to have the possibility to offer different therapies depending on the patients. In this sense the likelihood that the patient will suffer a recurrence of her disease is very important, so that the risks and expected benefits of specific therapies can be compared. 3. Experimental Data Data from 1035 patients with breast cancer disease from the Medical Oncology Service of the Hospital Clinical University of Málaga, were collected and recorded during the period 1990-2000. Data corresponding to every patient were structured in 85 fields containing information about post surgical measurements, particulars and type of treatment. Ten independent input variables, selected from all these data fields, and essentially pointed out by medical experts as suspictions of being risk factors for breast cancer prognosis, were incorporated to the model. All variables and their units or modes of representation, mean, standard deviation and median are shown in Table 1, where survival status appears as supervisory variable to be predicted by the prognosis system.
Table 1. Summary of patient data: range, mean, standard deviation and median
The prognostic factors in early breast cancer with adjuvant therapy after surgery, are time-dependent,
that is, the strength of prognostic factor is not the same for different time intervals. Besides, the existence of a “peak” of recurrence in the distribution of relapse probability [1] demonstrates that the recurrence probability is not the same over time. In order to select the most important prognostic factors for predicting overall survival, the approach presented in this work trains neural networks with different set of input data for each time interval under study (Table 2). Table 2. Selected attributes (prognostic factors) and number of patients for every patients follow-up time intervals (in months).
A previous analysis of each variable characteristics with medical experts, showed us that some of them
fit well into fuzzy set conditions. Three prognostic factors were fuzzify: tumor size, number of axillary lymph nodes, and grade of tumor. This process gives the possibility of estimating, for example, whether the tumor size is ‘small’, ‘median’, ‘large’, … depending on the interval time. 4. The Proposed Model
A solution scheme is proposed based on specific topologies of neural networks combined with a fuzzy system for different time intervals during the follow-up time of the patients and a threshold unit to implement the decision making process (Figure 1). Selected inputs to the network are pre-processed by the fuzzy system and then computed by a back-propagation artificial neural network.
4.1. Fuzzy System The variables fuzzily process (size of tumor, grade of tumor and number of axillary nodes) implies the selection of data corresponding to every time interval under study. The goal is to perform an specific study of the variables ranges, developing a filter to eliminate the patients whose specified parameters in every corresponding time interval are not correct.
The patients just belonging to the time interval under study are chosen to construct the fuzzy sets, and
their limits are estimated by means of intervals, taking into account that do not exist fixed bounds for them. These intervals were carried out using different percentiles that depend on the population. To
notice, that the finishes percentile is 99, because, if it is 100, the finishes function takes the value 1 in the maximum interval.
These intervals will be using different percentile, that depend of the populations. Note, that the last
percentile is 99, because if it is 100 the last function take a value equal 1 in the maximum interval, and this occurrence can be casual.
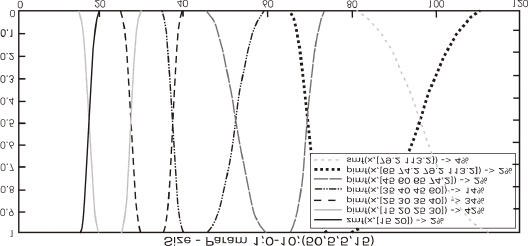
To establish the membership function of the fuzzy sets, we calculate the mode of the interval in
study to establish the interval with maximum ownership ( membership is equal to 1). We have implemented the extreme values for the first set with a zmf function and the one finishes with a ‘smf’ function. The rest of functions is ‘pimf’, we use these functions because they are flexible and easy of using. Figures 2 shows the histogram corresponding to one of the fuzzy variables (size of tumor) for an specific time interval before the fuzzyfy process, and figure 3 presents the fuzzy sets resulting after the fuzzyfy process for the same interval time.Frequency Size; Interval 0-10 Figure 2. variable size in the interval 0 -10 Figure 3. Fuzzy sets for the variable size in the interval 0 -104.2 The Neural Networks System
The neural networks system computes an attributes sets from fuzzy system giving a value corresponding to the a posterior probability of relapse for the patient in study. The networks topology employed is multilayer perceptron with the Levenberg-Marquardt learning algorithm. The input layer has so many elements as attributes suspictions of being risk factors for each time interval. The middle or hidden layers have 12, 17, 8, 11 and 16 elements respectively with hyperbolic tangent transfer functions. The output layers have one logistic element corresponding to the single dependent variable. The outputs elements predict the relapse probability by means of its numerical output (ranged from 0 to 1).
A crucial aspect of doing learning and prediction analysis with a neural network system is to split the
database into two independent sets which will be used to train the neural network and to validate its predictive performance. During training the data vectors of the training set are repetitively presented to the network, that attempts to generate a 1 at the output unit when the survival status of the patient is relapse, and a 0 when the status is non-relapse.
In order to evaluate the proposed model, a standard technique of stratified 10-fold cross-validation was
used [9]. This technique divides the patient data set into ten sets of approximately equal size and equal distribution of recurrent and non-recurrent patients. In each experiment a single set is used for testing the model that has been developed from the remaining nine sets. The evaluation statistics for each method is then assessed as an average of ten experiments.
4.3 Threshold unit The threshold unit outputs a class for survival status. In order to obtain an appropriate classification accuracy, which is expressed in percent of patients in the test set that were classified correctly, a cut-off prediction between 0 and 1 had to be chosen before any output of the network (ranged from 0 to 1) could be interpreted as a prediction of breast cancer relapse. 5. Results In order to evaluate the correct classification probability of the proposed system and to establish a comparison with those results obtained in the previous work, the system was trained with and without pre-processing the input variables through the fuzzy subsystem, and the results, together with the a priori classification probability (PCP), have been simultaneously plotted in a diagram bar (Fig. 4).
Two important results are observed in figure 4: (1) the proposed system always improves the non-fuzzy
system. It is important to point out the difficult of this, given so high values of PCP for each time interval, and (2) this improvement is greater in the most critical interval during the follow-up time of the patients (interval I2).
Probability Correct Classification Time Intervals 6. Conclusions and Future Work Different topologies of feed-forward fuzzy-neural networks were used to obtain an optimal prediction accuracy for correct classification probability of patients relapse after breast cancer surgery using clinical- pathological data. The final prognosis system, based on a fuzzy block for pre-processing the system inputs, makes predictions about the relapse probability at different times of follow-up with a very little error ratio. The most important goal was to eliminated the subjective process performed by experts in the discretizing of three variables suspected of being risk factors for breast cancer prognosis. Other variables could not be fuzzify because of the lack of information to perform the discretizing process.
The obtained results encourage us to continue this line of research analyzing different possibilities to
fuzzify other prognostic variables (re, rp) studying their relationships with other data presented in the patiens database. Also, new techniques, different to mode, for constructing the fuzzy sets can be proposed. On the other hand, we are actually working in designing a cooperative neuro-fuzzy system where the neural networks system and the fuzzy system interact between them in order to improve the prognosis system classification accuracy.
References 1. Alba E. 1999. Estructura del patrón de recurrencia en el cáncer de mama operable (CMO) tras el
tratamiento primario. Implicaciones acerca del conocimiento de la historia natural de la enfermedad. 7º Congreso de la Sociedad Española de Oncología Médica, Sitges, Barcelona Abril 1999.
2. Carlos Andrés Peña Reyes, Moshe Sipper. A fuzzy genetic approach to breat cancer diagnosis.
Artificial Intelligence in Medicine: 131-155, 1999.
3. Cox DR 1972. Regression Models and life tables. JR Stat Soc [B] 34:187 – 220, 1972. 4. Delgado D. Verdegay J. L. Vila M. A. 1993. On aggregation operations of lingüistic labels, Internat.
5. Duda RO, Hart PE. 1973. Pattern classification and scene analysis. New York. John Wiley and Sons,
6. Fodor J. and Roubens M. 1994. Fuzzy Preference Modelling and Multicriteria Decision Support.
7. Friedrich Steimann. On the use and usefulness of fuzzy sets in medical AI. Artificial Inteligence in
8. Kaplan SA, Meier, P 1958. Nonparametric estimation from incomplete observations. J. Am Stat
9. Patterson, D.W. Artificial Neural Network, Theory and Applications, Prentice Hall, 1996. 10. White H. Learning in artificial neuronal network: a statistical approach. Neural computation 1: 425 –
11. McGuire W.L., Tandom A.T., Allred D.C., Chamnes G.C., Clark G.M., How to use prognostic
factors in axillary node-negative breast cancer patients . J Natl Cancer Inst 82:1006-1015, 1990.
12. Jerez, J.M., Gómez, J.A., Muñoz, J., Alba, E. A model for prognosis of early breast cancer. In
Problems in Applied Mathematics and Computational Intelligence. ISBN: 960-8052-30-0, pp.165-170, 2001.
KENNY DIXON NARRATIVE JAM (post) Producer: Lanie Zipoy, Director: Sandy Garfunkel Artifice - feature (post) Jefferson Lives Prod: Adam Schneider, Dir: Stephen Cognetti Grauman’s Last Hero Free Parking Pet Hates (post) Extrospection Davy Crockett Prod: Matthew Stuar,t Dir: Dee A. Robertson Sexy, Sexy, Sexy Khan Prod: Matthew Stuart, Dir: Dee A. Rober
On Appeal from the United States District Court BRIEF OF THE EQUAL EMPLOYMENT ADVISORY COUNCIL AS AMICUS CURIAE IN SUPPORT OF DEFENDANT-APPELLANT CORPORATE DISCLOSURE STATEMENT Pursuant to Fed. R. App. P. 26.1 and 29(c), Amicus Curiae Equal Employment Advisory Council discloses the following: The Equal Employment Advisory Council has no parent No publicly held company owns 10% or mor
 notice, that the finishes percentile is 99, because, if it is 100, the finishes function takes the value 1 in the maximum interval.
These intervals will be using different percentile, that depend of the populations. Note, that the last
percentile is 99, because if it is 100 the last function take a value equal 1 in the maximum interval, and this occurrence can be casual.
To establish the membership function of the fuzzy sets, we calculate the mode of the interval in
study to establish the interval with maximum ownership ( membership is equal to 1). We have implemented the extreme values for the first set with a zmf function and the one finishes with a ‘smf’ function. The rest of functions is ‘pimf’, we use these functions because they are flexible and easy of using. Figures 2 shows the histogram corresponding to one of the fuzzy variables (size of tumor) for an specific time interval before the fuzzyfy process, and figure 3 presents the fuzzy sets resulting after the fuzzyfy process for the same interval time.
Frequency
notice, that the finishes percentile is 99, because, if it is 100, the finishes function takes the value 1 in the maximum interval.
These intervals will be using different percentile, that depend of the populations. Note, that the last
percentile is 99, because if it is 100 the last function take a value equal 1 in the maximum interval, and this occurrence can be casual.
To establish the membership function of the fuzzy sets, we calculate the mode of the interval in
study to establish the interval with maximum ownership ( membership is equal to 1). We have implemented the extreme values for the first set with a zmf function and the one finishes with a ‘smf’ function. The rest of functions is ‘pimf’, we use these functions because they are flexible and easy of using. Figures 2 shows the histogram corresponding to one of the fuzzy variables (size of tumor) for an specific time interval before the fuzzyfy process, and figure 3 presents the fuzzy sets resulting after the fuzzyfy process for the same interval time.
Frequency