Manager Report
Franklin Templeton Investment Funds Franklin Income Fund
For Professional investor use only. Not to be distributed to retail investors.
Fund Characteristics Overview
• U.S. equity indexes delivered mixed returns in November as investor fears intensified about
whether a bipartisan deal could be struck to avert the impending 2013 “fiscal cliff” of tax hikes and
• In the equity portion of the fund, the utilities, materials and energy sectors detracted most from
performance in November. The fund’s overall negative equity performance was partially offset by
small gains in the consumer discretionary, consumer staples and industrials sectors.
• The fixed income portion’s positive performance was led by corporate bonds in the technology,
electric utility and capital goods sectors. However, the natural gas and banking sectors had small
Custom 50% S&P 500 +50% Barclays U.S.
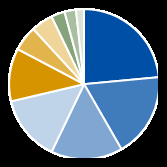
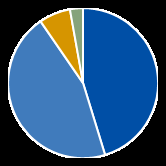
Portfolio Allocation (%) Equity—Sector Breakdown (% of Equity) Fixed Income—Credit Quality Breakdown (% of Total) Cumulative Performance (%) Historical Performance 30 November 2012 Since Incept 3 Mths 6 Mths (01.07.99)
Franklin Income Fund - A(Mdis) USD—NAV
Custom 50% S&P 500 + 50% Barclays U.S. Aggregate Index USD
Calendar Year Returns (%) Franklin Income Fund - A(Mdis) USD—(NAV) Custom 50% S&P 500 + 50% Barclays U.S. Aggregate Index
For information related to the headings “Fund Characteristics”, “Portfolio Allocation”, “Sector Breakdown”, “Credit Quality Breakdown”, “Franklin Income Fund - A(Mdis) USD—NAV”,
please see note regarding Fund Characteristics data and Fund Ratings on back page. Source: Franklin Templeton Investments, 30 November 2012.
Past performance does not guarantee future results.
Where a Fund invests in emerging markets, this investment can be more risky than an investment in developed markets. Ratings are determined using the Barclays Index Rating
System, which is composed of a blended rating between Standard & Poor’s, Fitch, and Moody’s rating services. Weightings as a percent of total.
Franklin Income Fund 30 November 2012
For Professional investor use only. Not to be distributed to retail investors.
Market Review
U.S. stocks fell in the first half of November amid uncertainty in the aftermath of Hurricane Sandy and President Barack Obama’s re-election, when investors’ fears intensified about whether a bipartisan deal could be struck to avert the impending 2013 “fiscal cliff” of tax hikes and spending cuts. Evidence of upward momentum in U.S. housing and a reacceleration in the Chinese economy subsequently had a positive impact on the market, as did some optimism regarding a potential U.S. fiscal resolution. U.S. equity indexes were mixed, but many stocks produced small gains. The utilities, energy, telecommunication services and financials sectors experienced declines, while the consumer discretionary, materials, industrials and consumer staples sectors gained. According to Russell U.S. indexes, mid-capitalisation stocks posted marginally better gains than small-company stocks, both of which fared better than large caps. By investment style, growth stocks outperformed their value counterparts.
U.S. gross domestic product (GDP) growth and several other indicators improved significantly in November. Revisions to third-quarter GDP increased it to 2.7% annualised from 1.3% in the first quarter. More recently, fourth-quarter consumer sentiment and spending activity have been robust. The U.S. labour market added 146,000 new jobs in November, and the unemployment rate edged down from 7.9% in October to a nearly four-year low of 7.7%. Given broadly improved trends in hiring, spending and household debt reduction, a key gauge of consumer confidence in November reached its highest level in four years. In contrast, November surveys suggested subdued factory activity worldwide and business confidence at notably low levels in the U.S., the eurozone and Japan. Reflecting falling exports and a generally weak global trade environment, U.S. manufacturing contracted slightly in November as new orders fell. The U.S. services sector continued to outperform the factory sector, however, as new orders in services industries jumped to an eight-month high.
Performance Review and Contributors to Performance
In November, the equity portion of the fund declined in value, while the fixed income portion added modestly to returns and helped mitigate overall losses for the month. In the equity portion of the fund, the utilities, materials and energy sectors detracted most from performance in November. A generally down month for utilities stocks negatively affected the fund’s Exelon and Entergy shares. Materials stocks were hindered by gold mining companies foremost; gold-focused miners generally suffered in November from a combination of lower gold prices, higher operating expenses, and ebbing production among some of the world’s largest gold mining companies. As such, the fund’s equity positions in Barrick Gold and Newmont Mining lost value during the month. Gains in the energy sector were constrained by widespread forecasts for slower global growth against adequate 2013 oil and natural gas supplies and slack demand, particularly in developed countries. The fund’s largest energy detractors were Chesapeake Energy, an oil and natural gas exploration and development company operating in the U.S., and energy conglomerate Exxon Mobil.
The fund’s overall negative equity performance was partially offset by small gains in the consumer discretionary, consumer staples and industrials sectors. Volkswagen International Finance provided nearly all of the fund’s overall gain in consumer discretionary, while the fund’s two consumer staples holdings also gained. The fund’s four industrials holdings each posted slight gains for the month. Other contributors included health care company Roche Holding, and diversified financial services provider Bank of America.
The fixed income portion’s positive performance was led by corporate bonds in the technology, electric utility and capital goods sectors. Corporate debt positions in FirstData and Freescale Semiconductor comprised nearly all of the fund’s gains in the technology sector this month, while a position in Energy Future Holdings offered the most significant boost to the fund’s electric utility bonds. Among the fund’s 12 bond positions in the capital goods sector during the month, 10 advanced, aided by strong contributions from Reynolds Group Issuer, which is a subsidiary of leading global manufacturer and supplier of consumer beverage and foodservice packaging products Reynolds Group Holdings Limited, and Mexican building materials supplier and cement producer Cemex. Gains across most of the bond sectors held by the fund were diluted somewhat by small negative returns in the natural gas and banking sectors. Among natural gas holdings, Niska Gas Storage U.S. and El Paso detracted slightly from results, as did our sole holding in banking, JP Morgan Chase.
Portfolio Positioning
In November, the fund’s asset mix changed as equity securities were reduced from 53.30% of total holdings to 51.91% by month-end and fixed income securities fell from 46.55% to 45.27% as the cash position increased to 2.82%. Our equity investments are primarily common stocks with some convertible preferred shares. Fixed income investments are concentrated in high-yield corporate bonds. The fund’s largest equity sector allocations at month-end were in utilities (12.20%) and financials (9.45%), in which we have been slowly increasing exposure over the past year. Our largest month-end exposures in fixed income were in the technology, energy and communications sectors.
We have seen a fairly meaningful shift in the asset allocation of the fund since the end of 2011. Asset allocation is the result of looking at the characteristics of individual securities and the potential opportunities we see in the market to meet the investment objective of maximising income while maintaining prospects for capital appreciation. Presently, we are more invested in equities than we have been in quite some time.
On the fixed income side, profit-taking on our part and refinancing activity by companies that result in our corporate bond positions being called or tendered have been the main drivers in the reduction of the fund’s fixed income exposure. We have been shifting this cash primarily into equity common stock as that is where we believe the best opportunities in the market are at this time.
Franklin Income Fund 30 November 2012
For Professional investor use only. Not to be distributed to retail investors.
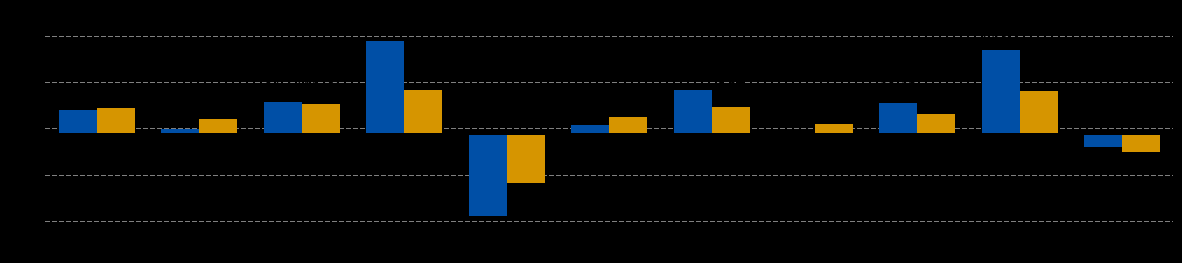
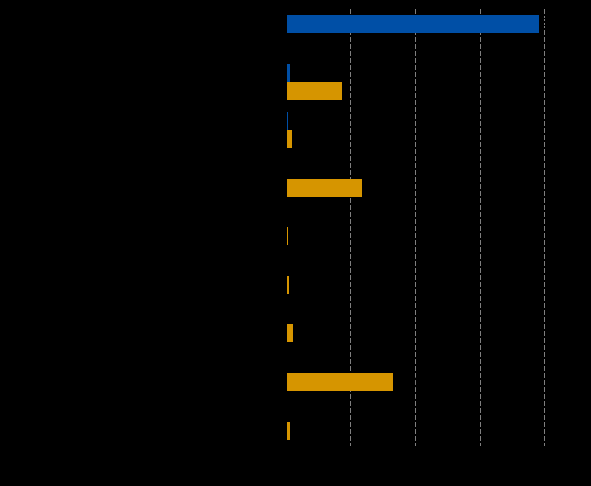
Performance Review and Contributors to Performance (continued) Equity—Sector Weightings vs. Benchmark (% of Equity) Fixed Income—Sector Weightings vs. Benchmark (% of Total) Franklin Income Fund S&P 500 Index Franklin Income Fund Barclays U.S. Aggregate Index Quality Allocation vs. Benchmark (%) Equity—Portfolio Characteristics Franklin Income Fund Barclays U.S. Aggregate Index Earnings Book Value Cash Flow Dividend Market Cap (USD Millions) Fixed Income—Portfolio Characteristics Portfolio
Source for the Fund’s “Sector Weightings” above: Franklin Templeton Investments as of 30 November 2012. Holdings of the same issuer have been combined.
Source for the above figures: Franklin Templeton Investments as of 30 November 2012. Weightings as a percent of total.
For information related to the heading “Portfolio Characteristics” above, please see note regarding Fund Characteristics data on back page. Source: Franklin Templeton Investments,
30 November 2012. Past performance does not guarantee future results.
Where a fund invests in emerging markets, this investment can be more risky than an investment in developed markets.
Source: Franklin Templeton. The average credit quality (ACQ) rating may change over time. The portfolio itself has not been rated by an independent rating agency. The letter rating,
which may be based on bond ratings from dif erent agencies, is provided to indicate the average credit rating of the portfolio’s underlying bonds and general y ranges from AAA (highest)
to D (lowest). The ACQ is determined by assigning a sequential integer to all credit ratings AAA to D, taking a simple, asset-weighted average of debt holdings by market value and
rounding to the nearest rating. The risk of default increases as a bond’s rating decreases, so the ACQ provided is not a statistical measurement of the portfolio’s default risk because
a simple, weighted average does not measure the increasing level of risk from lower rated bonds. The ACQ is provided for informational purposes only. Derivative positions and unrated
securities are not reflected in the ACQ.
Yield figures quoted should not be used as an indication of the income to be received.
Ratings shown are assigned by one or more Nationally Recognized Statistical Rating Organizations (“NRSRO”), such as Standard & Poor’s, Moody’s and Fitch. The ratings are an
indication of an issuer’s creditworthiness and typically range from AAA or Aaa (highest) to D (lowest). When ratings from all three agencies are available, the middle rating is used; when
two are available, the lowest rating is used; and when only one is available, that rating is used. Foreign government bonds without a specific rating are assigned the country rating
provided by an NRSRO, if available. The NR category consists of rateable securities that have not been rated by an NRSRO. This breakdown only pertains to the fixed income
component of the portfolio; cash and equivalents (defined as bonds with stated maturities, or that can be redeemed at intervals, of seven days or less) as well as derivatives are
excluded. As a result, the chart does not reflect the fund’s total net assets.
30 November 2012. Past performance does not guarantee future results. Franklin Income Fund 30 November 2012
For Professional investor use only. Not to be distributed to retail investors.
Performance Review and Contributors to Performance (continued) Top Ten Holdings Security Equity—Top Contributors (by Issuer) Equity—Top Detractors (by Issuer) Security Security Fixed Income—Top Contributors (by Issuer) Fixed Income—Top Detractors (by Issuer) Security Security
Percentage may not total 100% due to rounding. Information is historical and may not reflect current or future portfolio characteristics. All portfolio holdings are subject to change.
The Ten Largest Holdings represent the ten largest holdings of the fund as of the date indicated. These securities do not represent all of the securities purchased, sold or recommended
for advisory clients, and the reader should not assume that investment in the securities listed was or will be profitable. All portfolio holdings are subject to change.
Holdings of the same issuer have been combined.
The portfolio manager for the Fund reserves the right to withhold release of information with respect to holdings that would otherwise be included in the top 10 holdings list.
Source for the above figures: FactSet Research System, Inc. as of 30 November 2012. Index statistics calculated by FactSet Research Systems, Inc. Profile data is calculated as
a percentage of total. Contributors and Detractors are relative to the index.
Holdings of the same issuer have been combined.
Franklin Income Fund 30 November 2012
For Professional investor use only. Not to be distributed to retail investors.
Investment Outlook
Relative uncertainty remains about the overall global macroeconomic outlook that is especially focused on Europe, a slowdown in growth in emerging markets and the challenges that lie ahead for the U.S. economy with the impending fiscal cliff heading into 2013. In this environment, we believe dividends and share buybacks are likely to continue receiving a strong focus from investors. We believe there is opportunity to find attractive yields in the equity markets, which is a reason why the equity weighting in the fund has increased over time.
We remain focused on finding equity and fixed income investment opportunities that may be able to capture current income, maintain prospects for capital appreciation and look attractively valued to us relative to long-term potential. Our research efforts seek unique investment opportunities that we believe offer a potential for income and solid long-term returns on a risk-adjusted basis.
We seek to maximise income while maintaining prospects for capital appreciation by investing, under normal market conditions, in a diversified portfolio of debt and equity securities. We continue to focus our research efforts on unique investment opportunities we believe offer a potential for income and solid long-term returns on a risk-adjusted basis. Our long-term approach remains consistent as we look across a wide range of asset classes, seeking the most compelling opportunities for income generation and long-term growth potential.
Investment Objective
The Fund aims to maximise income while maintaining prospects for capital appreciation by investing primarily in stocks, bonds and convertible securities. The Fund may invest up to 25% of its net assets in non-U.S. securities.
Investment Philosophy
The management team believes that they can identify unique investments with the potential to deliver attractive risk-adjusted total returns. They seek to profit from long-term investments maintaining a fundamental view that differs from the “market consensus” regarding growth potential or valuation. They focus on investment opportunities that they believe offer the most compelling risk/reward trade-off between growth potential, valuation and risk. The team utilises a flexible and diversified approach, searching across various asset classes including equities, fixed income and convertibles to meet the fund’s investment objective.
Portfolio Management Team
Edward Perks is a senior vice president and director of Portfolio Management. He is lead portfolio manager for Franklin Income Fund and related portfolios. He is also lead portfolio manager for Franklin Balanced Fund, and co-lead portfolio manager for Franklin Equity Income Fund. As director of Portfolio Management, Mr. Perks oversees investment strategies including U.S. Core, Hybrid, Sector and U.S. Growth.
Mr. Perks joined Franklin Templeton Investments in 1992. His prior responsibilities have included equity research across a wide range of industries and lead portfolio manager of convertible securities. He became portfolio manager of Franklin Income Fund in 2002.
Mr. Perks holds a B.A. in economics and political science from Yale University. He is a Chartered Financial Analyst (CFA) Charterholder, a member of the CFA Institute, and the Security Analysts of San Francisco (SASF).
Charles B. Johnson is a chairman and director of Franklin Resources, Inc., and chairman and director of various Franklin Templeton funds. He joined Franklin Distributors, Inc., as president and chief executive officer in 1957 and assumed those positions with Franklin Resources when it was organised in 1969. Mr. Johnson served as CEO until 2003.
Mr. Johnson is a past member of the New York Society of Security Analysts. In 1992, he was elected chairman of the National Association of Security Dealers (NASD) and served on various committees and boards of the NASD (including NASDAQ) from 1988-2002. Previously, Mr. Johnson served on the Board of Governors of the Investment Company Institute from 1973-1988.
Mr. Johnson is a member of the Board of Overseers of the Hoover Institution at Stanford University. In addition, Mr. Johnson is a board member of the Bay Area Council and other Bay Area civic organisations. He served as the Northern California chairman of the U.S. Olympic Committee in 1992 and on the boards of the San Francisco Symphony from 1985-2002, the Peninsula Community Foundation from 1986-1996 and the Commonwealth Club of California from 1994-1997, and as a trustee of Crystal Springs Uplands School from 1985-1993.
Mr. Johnson received a B.A. degree in economics and political science from Yale University. He served in the U.S. Army as a first lieutenant, Army Artillery.
Franklin Income Fund 30 November 2012
For Professional investor use only. Not to be distributed to retail investors.
Explanatory Notes Fund Characteristics: The Price to Earnings, Price to Cash Flow and Price to Book Value calculations shown herein use harmonic means. Values less than 0.01 (i.e. negative value) are
excluded and values in excess of 200x are capped at 200x. Yields above 100% are also excluded. For the benchmarks, no limits are applied to these ratios in keeping with the benchmark’s
calculation methodology. Market capitalisation statistics are indicated in the base cur ency for the portfolio presenter. Yield figures quoted should not be used as an indication of the income to
be received. Fund Ratings: S&P Fund Management Ratings 2012, McGraw-Hill Companies, Ltd. trading as Standard & Poor’s (“S&P”). Fund performance data include reinvested dividends, and is net of management fees. Sales charges, other commissions, taxes and other relevant costs to be aid by the investor are
not included. Disclaimers: Due to data limitations all equity holdings are assumed to be the primary equity issue (usually the ordinary or common shares) of each security’s issuing company. This methodology may
cause smal dif erences between portfolio’s reported characteristics and the portfolio’s actual characteristics. In practice, Franklin Templeton’s portfolio managers invest in the class or type of
security which they believe is most appropriate at the time of purchase. The market capitalisation figures for both the portfolio and the benchmark are the security level, not aggregated up to
the main issuer. The dividend yield quoted here should not be used as an indication of the income to be received from this portfolio. Top Security Contributors and Top Security Detractors are holdings based on the last one month period for rolling months or on the last three months period for quarter end months. These
securities do not represent all the securities purchased, sold or recommended for advisory clients, and the reader should not assume that investment in the security listed was or will be
profitable. Holdings are subject to change, holdings of the same issuer have been combined. The information provided is not a recommendation to purchase, sel or hold any particular
security. The security identified does not represent the composite’s entire holdings and in the aggregate, may represent a smal percentage of such holdings. There is no assurance that
security purchased will remain in the composite, or that security sold will not be repurchased. Securities mentioned in this report are not a solicitation to purchase those securities, and are examples of some securities which performed well. Not all securities in the portfolio performed
well. These securities do not represent all the securities purchased, sold or recommended for advisory clients, and the reader should not assume that investment in the security listed was or
will be profitable. Holdings are subject to change, holdings of the same issuer have been combined. The information provided is not a recommendation to purchase, sel or hold any particular
security. The security identified does not represent the composite’s entire holdings and in the aggregate, may represent a smal percentage of such holdings. There is no assurance that
security purchased will remain in the composite, or that security sold will not be repurchased. Performance figures are not based on audited financial statements and assume reinvestment of interest and dividends. When comparing the performance of Franklin Templeton Investment
Funds (the “Fund”) with a benchmark index, it is important to note that the securities in which Franklin Templeton Investment Funds invests may be substantially dif erent than those
represented by the benchmark index. Furthermore, an investment in Franklin Templeton Investment Funds represents an investment in a managed investment company in which certain
charges and expenses, including management fees, are applicable. These charges and expenses are not applicable to indices. Lastly, please note that indices are unmanaged and are not
available for direct investment. Certain data and other information shown have been supplied by outside sources. While we consider that information to be reliable, we give no assurance that
such data and information is accurate or complete. The indices are provided only to show the investment environment during the specific periods shown. The performance of each index does not include the deduction of expenses and does not
represent the performance of any Franklin Templeton fund. The indices include a greater number of securities than those held in the Fund. An index is unmanaged and one cannot invest
directly in an index. Past performance is no guarantee of future results. In addition, it should not be assumed that any securities mentioned were or will prove to be profitable. For the most current information on the fund, please contact your Franklin Templeton
marketing representative. Stocks mentioned in this report are not a solicitation to purchase those stocks, and are examples of some stocks which performed well. Not all stocks in the portfolio
performed as well. This document is intended to be of general interest only and does not constitute legal or tax advice nor is it an offer for shares or invitation to apply for shares of the Luxembourg-domiciled
SICAV Franklin Templeton Investment Funds (the “Fund”). Nothing in this document should be construed as investment advice. Given the rapidly changing market environment, Franklin
Templeton Investments disclaim responsibility for updating this material. Opinions expressed are the author’s at publication date and they are subject to change without prior notice. Subscriptions to shares of the Fund can only be made on the basis of the current prospectus and, where available, the relevant Key Investor Information Document, accompanied by the latest
available audited annual report and the latest semi-annual report if published thereafter. The value of shares in the Fund and income received from it can go down as well as up, and investors may not get back the full amount invested. Past performance is not an indicator nor a guarantee of future performance. Currency fluctuations may affect the value of overseas investments. When investing in a fund denominated in a foreign cur ency, your performance may
also be affected by currency fluctuations. An investment in the Fund entails risks which are described in the Fund’s prospectus and, where available, in the relevant Key Investor Information Document. In emerging markets, the risks can be greater than in developed markets. Investments in derivative instruments entail specific risks that may increase the risk profile of the fund and are more
fully described in the Fund’s prospectus and, where available, in the relevant Key Investor Information Document. No shares of the Fund may be directly or indirectly offered or sold to nationals or residents of the United States of America. Shares of the Fund are not available for distribution in all jurisdictions and prospective investors should confirm availability with their local Franklin Templeton Investments representative
before making any plans to invest. Any research and analysis contained in this document has been procured by Franklin Templeton Investments for its own purposes and is provided to you only incidentally. References to particular industries, sectors or companies are for general information and are not necessarily indicative of a fund’s holding at any one time. Please consult your financial advisor before deciding to invest. A copy of the latest prospectus, the relevant Key Investor Information Document, the annual report and semi-annual report, if
published thereafter can be found, on our website www.franklintempleton.hu or can be obtained, free of charge, from Franklin Templeton Investments, 1054 Budapest, Szabadság tér 7.
Hungary Tel: +36 1 354 3703; Fax: +36 1 354 3710. Issued by Franklin Templeton International Services S.A. - Professional of the Financial Sector under the supervision of the Commission de Surveil ance du Secteur Financier – Luxembourg.
Journal of Membrane Science 191 (2001) 215–223Modeling of the permeation swelling of emulsion during lacticacid extraction by liquid surfactant membranesJiang Yuanli a , ∗, Wang Fuan a, Kim Dong Hyun b, Lim Mee Sook ba College of Chemical Engineering, Zhengzhou University, Zhengzhou 450002, PR China b Department of Chemical Engineering, Kyungpook National University, Taegu 702-701,
The Use of Metformin in the Polycystic Ovary Syndrome There is increasing interest in the use of Metformin in womenwith PCOS. This information sheet outlines the current state ofSerious side effects to Metformin treatment are very rare. Inknowlegdge regarding its use in this condition. particular, Metformin does not cause hypoglycaemia. In the firstweek of taking Metformin, an upset stomach

 Manager Report
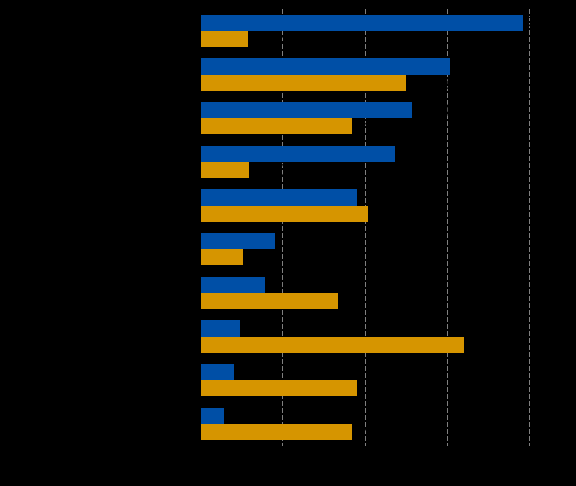
 Franklin Income Fund
 Franklin Income Fund